Server Status Monitoring
Starting from version 5.7.4, Staffcop’s server monitoring system has been replaced. Instead of InfluxDB and Telegraf, data collection is now based on a stack of Prometheus + Grafana + Node Exporter.
The system still provides administrators with a visual overview of server load. To use monitoring, please switch to the new stack.
Migration steps:
Make sure monitoring works and displays up-to-date data.
Attention
Upgrading a server does not automatically remove InfluxDB and Telegraf. Please note that migrating previously collected data is not supported. All server state information will be deleted when InfluxDB and Telegraf are removed. Before removing InfluxDB and Telegraf, ensure you have fully migrated to Prometheus and no longer need any old data.
If you have a custom Prometheus packet installed, delete it. If you have any questions, please contact technical support.
If necessary, configure scaling to receive metrics from additional servers.
If you are still using an older server version or are only planning to upgrade, use standard systemctl commands to manage old tools:
# Checking tool status
systemctl status influxdb
systemctl status telegraf

# Checking Grafana status
systemctl status grafana-server
Monitoring System Installation
For your convenience, we’ve prepared a universal script that will automatically install all components of the monitoring system.
Download the script to a computer with Grafana access and grant execution permissions:
wget https://distr.staffcop.su/docs-assets/grafana/monitoring_install.sh && chmod +x monitoring_install.sh
Run the script:
sudo ./monitoring_install.sh
The script will install the following monitoring system tools:
Prometheus
Node Exporter
Grafana
If Grafana is already installed, the script will update it to the latest available version.
After running the script, the tools are ready to use. Check if the tools are functioning using the following commands:
systemctl status prometheus
systemctl status node-exporter
systemctl status grafana-server
Attention
By default, Prometheus stores data for 80 days.
To change the retention period, edit the storage.tsdb.retention.time parameter in Systemd → /etc/systemd/system/prometheus.service.
Grafana Configuration
Grafana Login
To access Grafana, open your browser and go to:
http://<your-server-ip-address>:3000
where 3000 is the port number on which Grafana is installed.
Use the following credentials:
login: admin
password: admin
Connecting Prometheus
Once you’ve logged in to Grafana, connect Prometheus as a data source.
Go to Connections → Data sources.
Select + Add new data source.
In the interactive menu, select Prometheus.
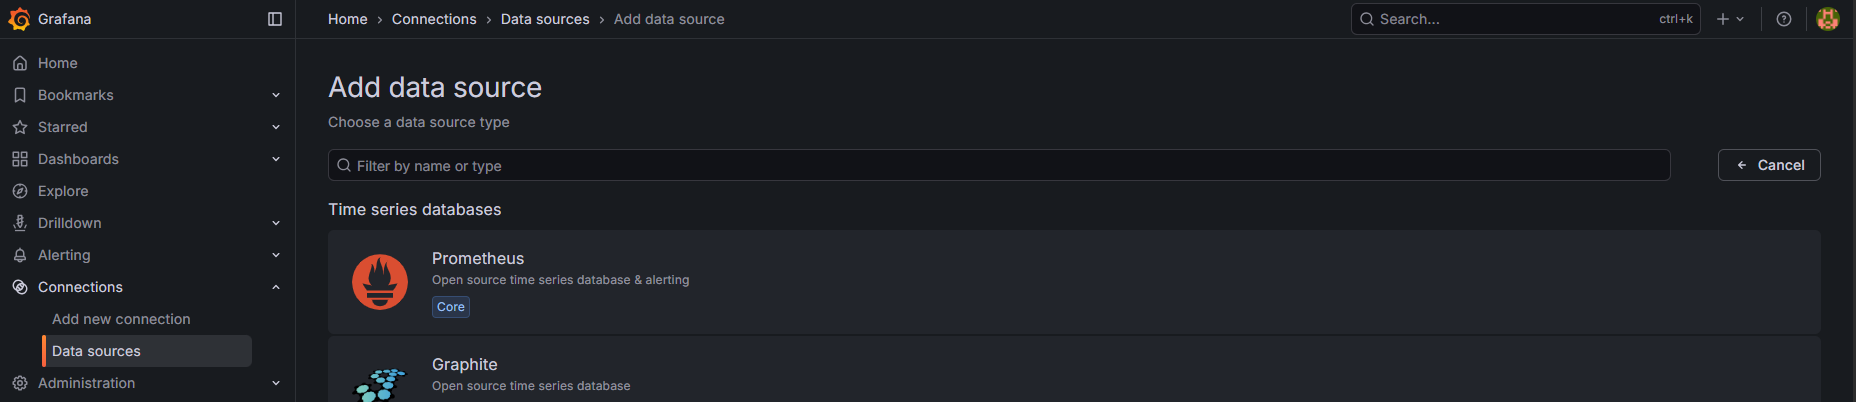
In the Prometheus server URL field, enter:
http://localhost:9090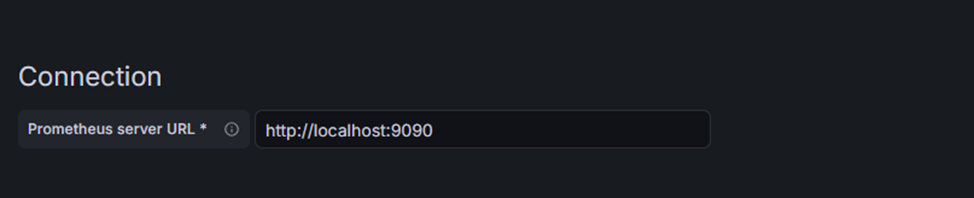
Scroll down and select Save & test.
A green notification should appear: Successfully queried the Prometheus API. This means the connection between Grafana and Prometheus has been established.

Importing a Dashboard
To avoid creating charts manually, we have prepared a ready-made dashboard.
Download the dashboard using the following link:
https://distr.staffcop.su/docs-assets/grafana/staffcop_node_exporter_dashboard.json
In Grafana, go to Dashboard.
Select New → Import.

Upload the downloaded dashboard.
Optional: change the name and folder.
In the Select a Prometheus data source field, select Prometheus as the data source.
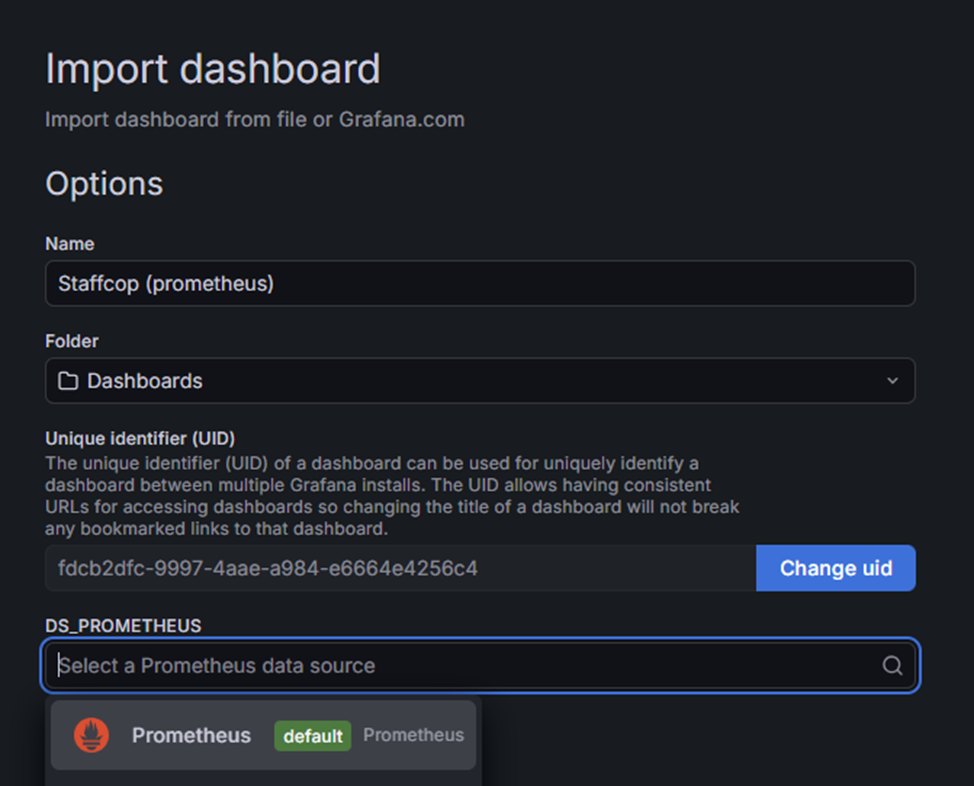
Select Import.
The imported dashboard can now be viewed.
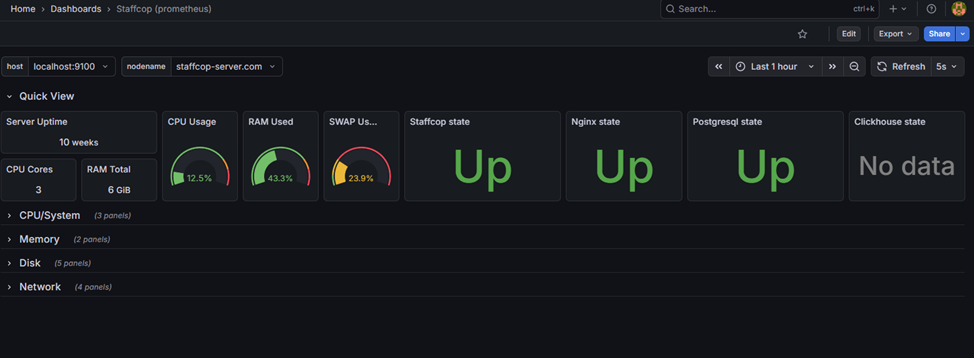
For convenience, the metrics are divided into several panels:
Quick View — server and tool general status
CPU/System — CPU load, total server load, disk usage percentage
Memory — amount of RAM used and OOM calls
Disk — disk load, IOps count, disk utilization, etc.
Network — network load
You can view detailed information about a metric by hovering over the i icon to the right of its name.
If you have any questions, please contact technical support.
Deleting influxDB and Telegraf
Danger
The previous server monitoring system used influxDB and Telegraf. If you were using these services and have switched to Prometheus, remove them to avoid unnecessary system load. Historical status data will be deleted.
To remove influxDB and Telegraf:
Stop both tools:
sudo systemctl stop influxdb
sudo systemctl stop telegraf
Remove their packets:
sudo apt-get remove --purge influxdb telegraf
Delete the remaining configuration files and data directories:
sudo rm -rf /var/lib/influxdb
sudo rm -rf /etc/telegraf
Remove old dashboards and influxDB datasources.
sudo rm /etc/grafana/provisioning/datasources/grafana-datasource.yaml
sudo rm /etc/grafana/provisioning/dashboards/default.yaml
sudo rm -rf /etc/grafana/provisioning/staffcop
Restart Grafana:
systemctl restart grafana-server
Last Updated: 06.07.26