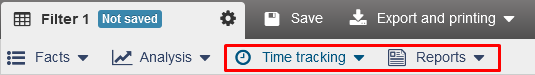
Reports
The pre-installed reports are divided into two sections: “Time tracking”and “Reports”
Time tracking
It represents a “strip chart” on which, to display the categories of productivity, “green”, “red”, and “gray” bars are marked.
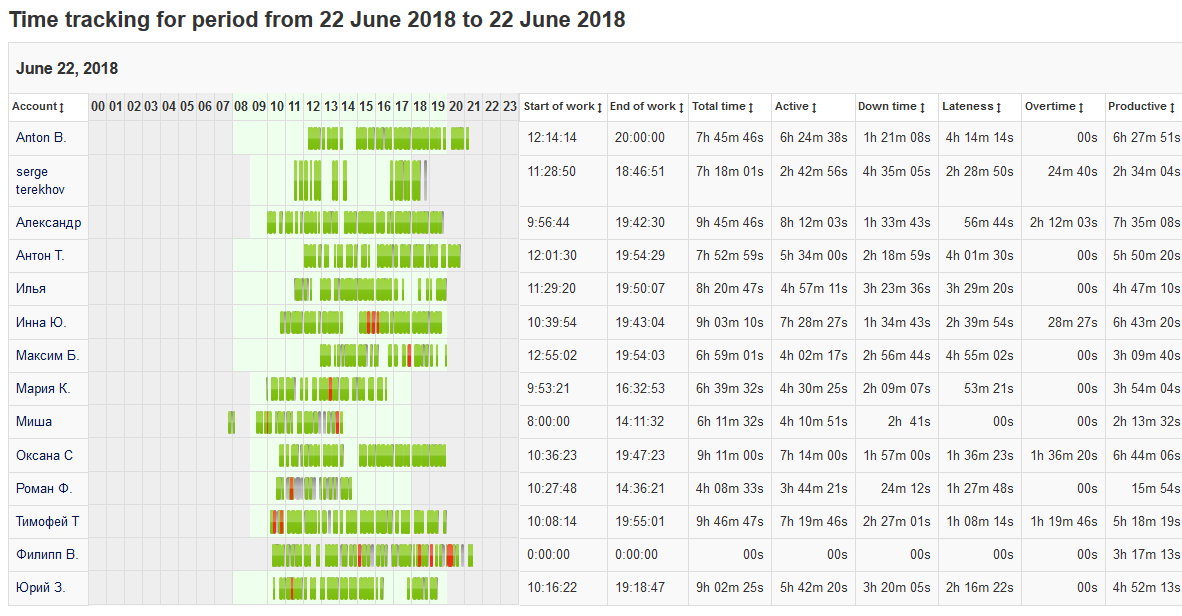
Green vertical bars mean that the user has performed activity in Productive applications or on Productive websites.
Red vertical bars mean that the activity in the specified period of time was completely or partially unproductive.
Grey bars mean that the activity took place, but it has not yet been assigned any type of productivity, that is, the category “Everything Else”.
The absence of bars means that there was no user activity - it could be breaks for lunch or for any personal need of an employee.
The graphic component allows you to quickly visually determine the productivity of an employee or employees.
If one time slot containes several events with different productivity categories the bar will be split accordingly with high of each element visualizing time of each activity.
In addition to the graphical component, the report contains a table indicating the points in time
Start of work
End of work
Total time
Active time
Downtime
Lateness
Overtime
Productivity categories
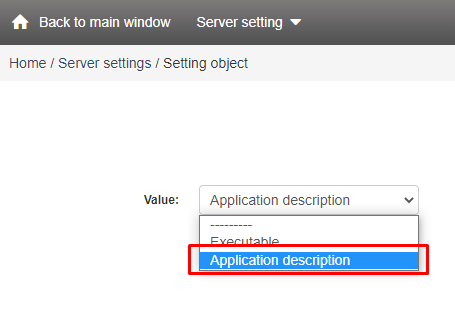
You can change the names of application executable files to Application Description. Go to Control Panel → Server Settings, locate Application Dimension in Reports in the list, and select Application Description from the dropdown menu under Values.
Productivity or unproductivity of user activity is defined by a set of filters that are applied when new information is received from users’ workstations. After processing new data with pre-installed filters (every 5 minutes) - labels of productive or unproductive activity are set. All preset filters can be modified\extended\removed.
You can also add your own filters and define the activity type of events getting into these filters as productive or unproductive activity.
“Time tracking” report is more suitable for a quick analysis of the productivity of all employees of the company or entire departments. Detailed reports on user activity where top-used applications and websites can be seen by clicking the left mouse button on the user or computer name that we are interested in.
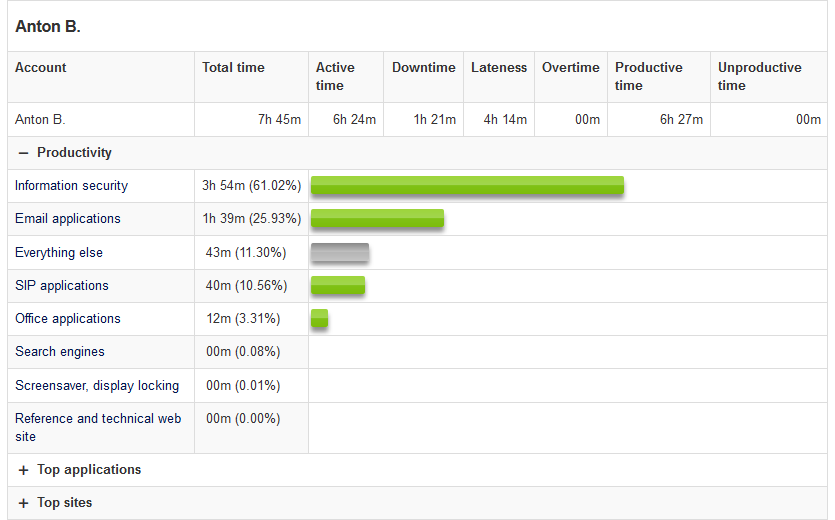
If you select an account, you will see a “detailed report on user activity” for a day:
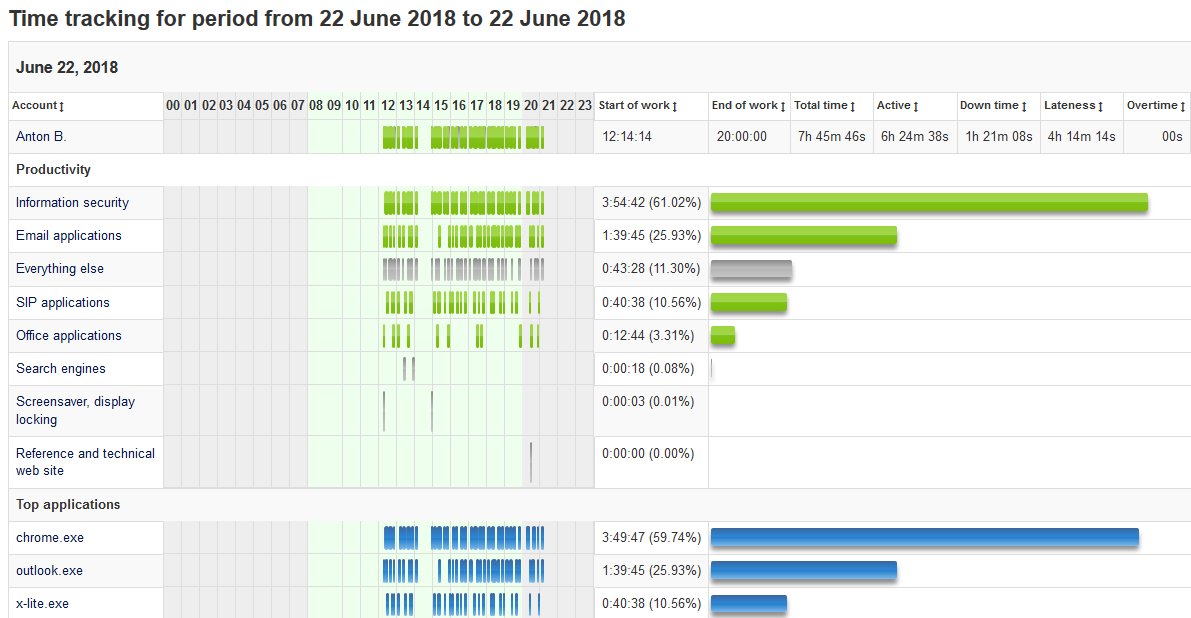
This report reveals the details of user activity on workstation. If you open a list of websites and applications, you can see time and duration of activity at the workplace. Also, we will be able to estimate the overall time contribution of each application or site to the user working day. Pre-installed filters contain a basic set of applications and sites that are assigned to a specific category of productive or unproductive activity.
Change productivity for policies of “Time tracking”
You can change the productivity category of an application or a website or add something by editing the filter that contains the relevant applications or websites.
To do this, click “Filters” tab at the bottom of the interface and expand any category of applications in the tree - “Policies -> Productivity policies -> Application categories”.
Click application category to see “cogwheel” icon. In the “Filter code” or “Constructor” tab, you can add or remove an application that corresponds to this category of applications. If you want to change the productivity, open “Properties” tab and select the required productivity category.
Click “Save” for the changes to take effect
Note
New productivity category for these applications will only be displayed on new data, all previous data will have the same statistics.
Note
You can force the recalculation of all eventswith the new productivity category, through the menu “Admin -> Rebuild reports”. Rebuilding reports can take some considerable time, up to several days, it is better not to execute this command without necessity.
The steps for changing productivity category for websites are the sane, in this case you should just specify site addresses.
It is possible to add applications and sites to filters directly from a report. To do this, click “cogwheel” icon near the application/website name:
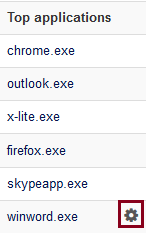
You will see the window for adding the application to the filters.
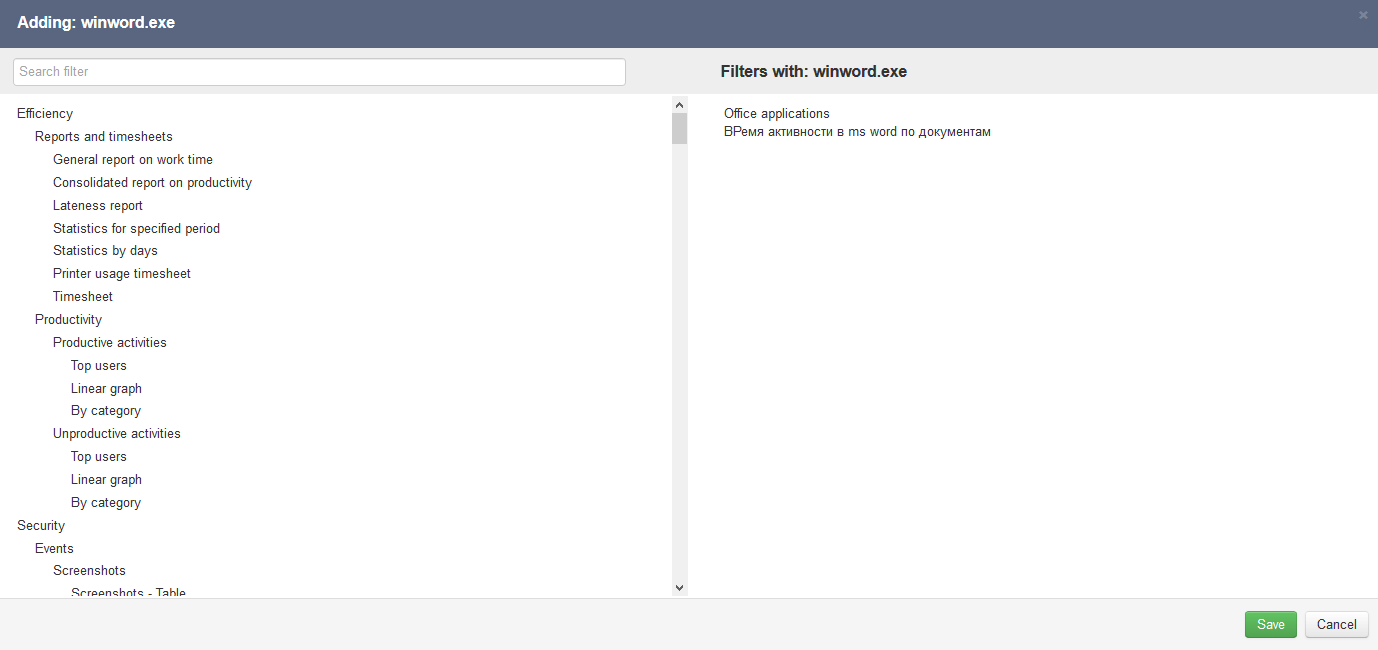
To add applications to the filter, click the required filter on the left side. It will be moved to the right side and get highlighted.
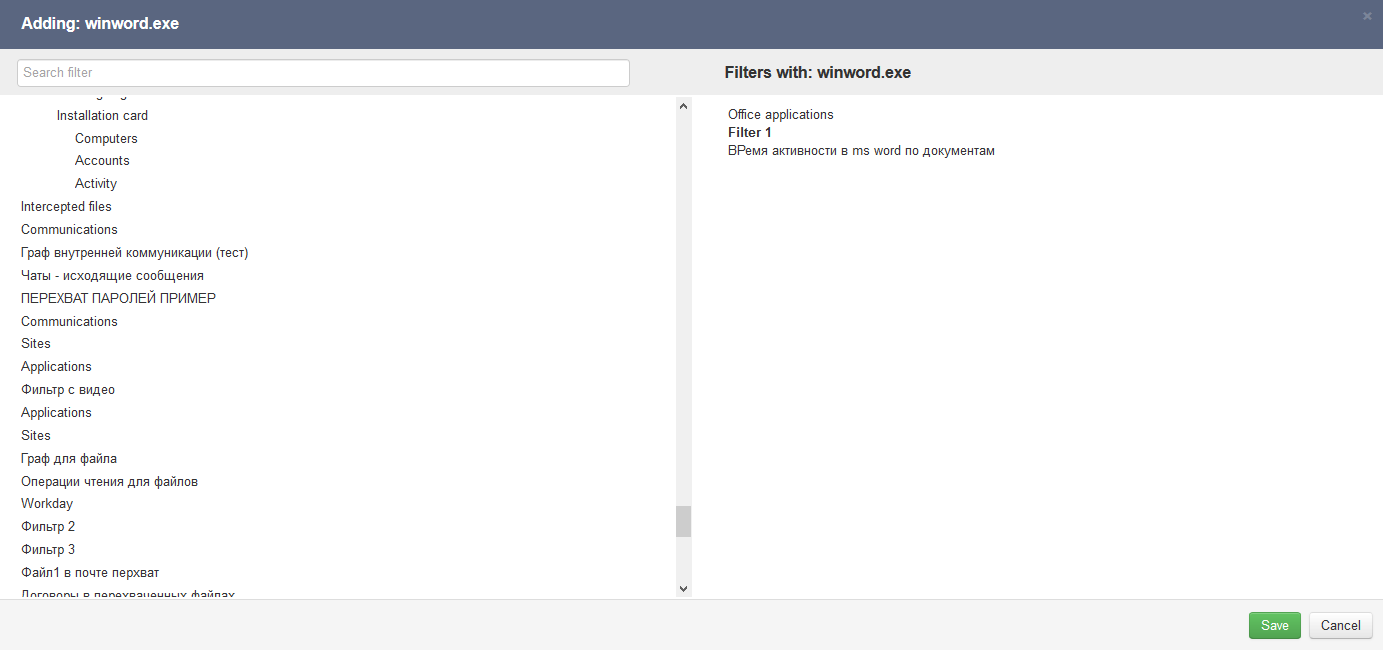
To remove filters, click the filter name you want to remove. Don’t forget to save changes.
Activity report for the period
displays active time, its productivity category, top applications, top sites.
This report is useful for getting an overview of user working day. You can see the category of applications he launches, the productivity category of user activity. Top sites visited by the user.
Adding sites and applications to the filters is also available for this report.
Productive time by department
The report displays the total time and percentage of productive, unproductive and neutral time to active time.
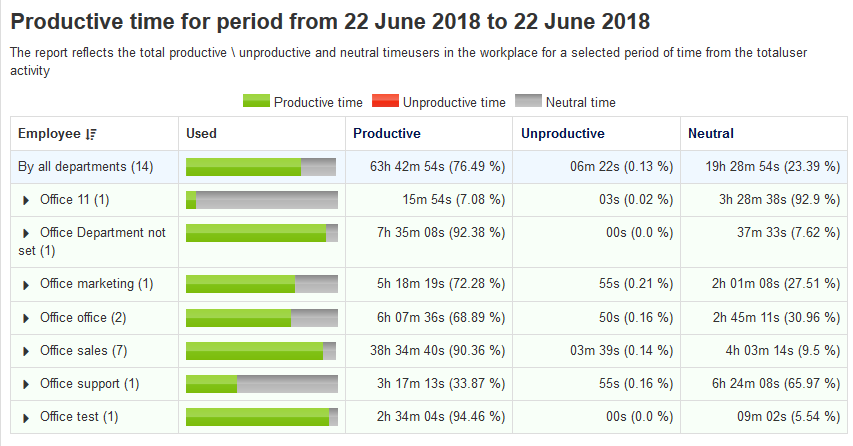
Allows you to compare departments and users on their productivity during working hours.
Active time by departments
The report displays the ratio of active time for the PC to the scheduled one, categorized by department.
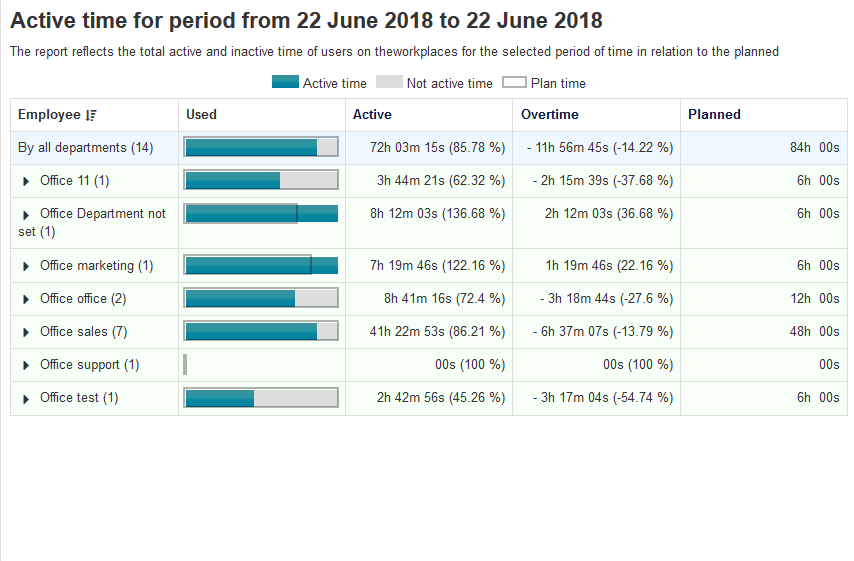
The report allows you to compare active time of PCs for different departments, define the number of overtimes and the load on employees.
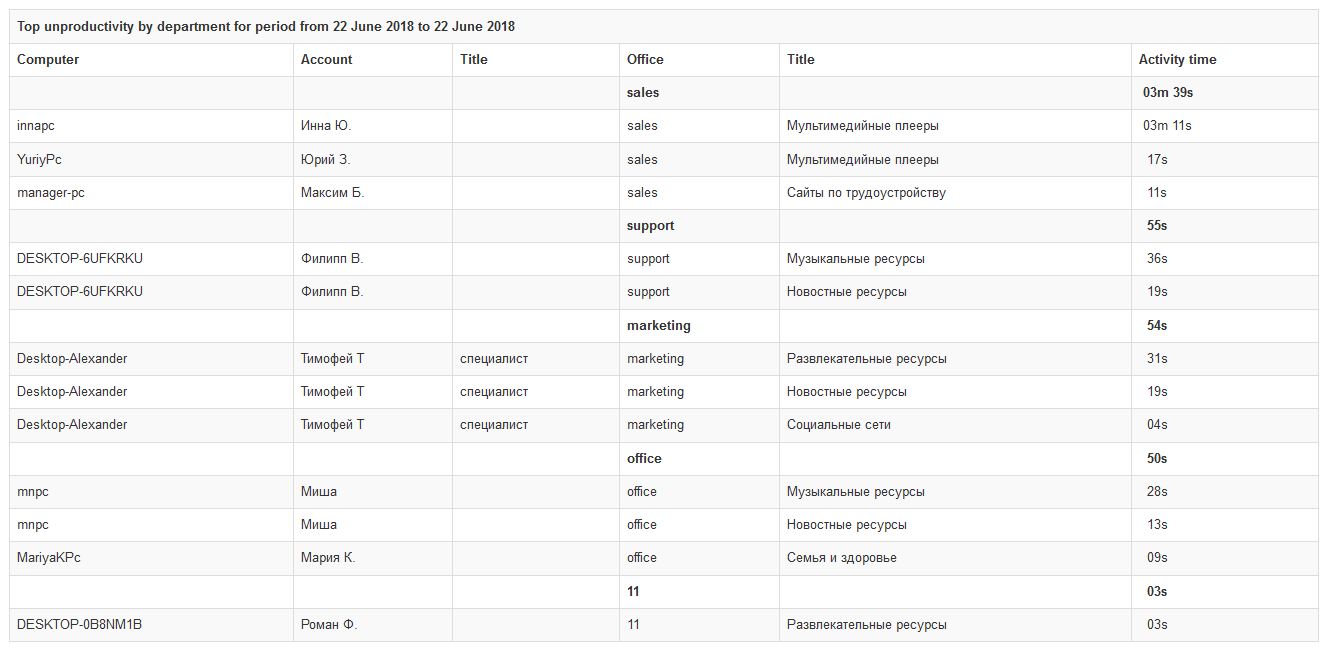
Top unproductive time by departments
The report displays top users by department, with the maximum unproductive time, and also the category of unproductive resources.
Summary report
The report displays the tops of users by category.
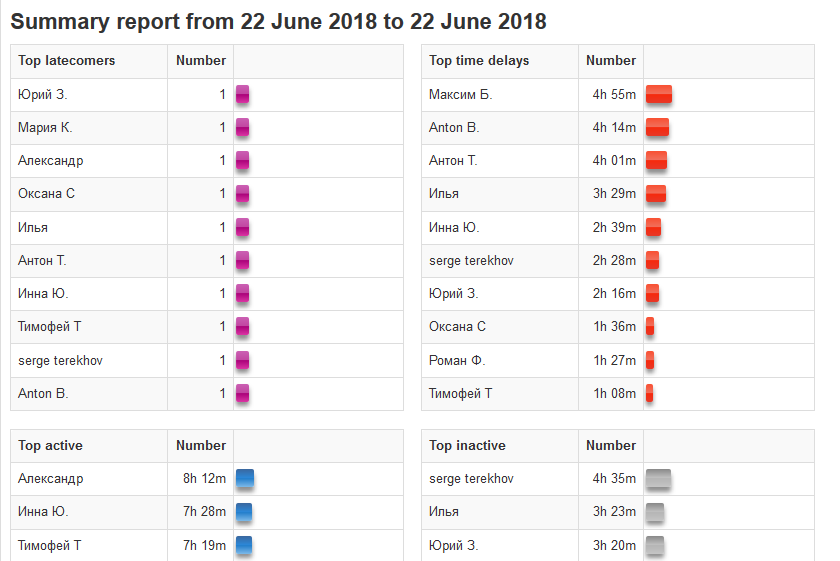
This type of report is meant for quick analysis of all the activities of the organization or selected employees for a specified period of time.
It shows in the graphic form all the most manifested trends:
Top latecomers/Top lateness time
Top active/Top inactive
Top productive/Top unproductive
And summary statistics in figures
Lateness report
The report displays the number and time of lateness of employees.
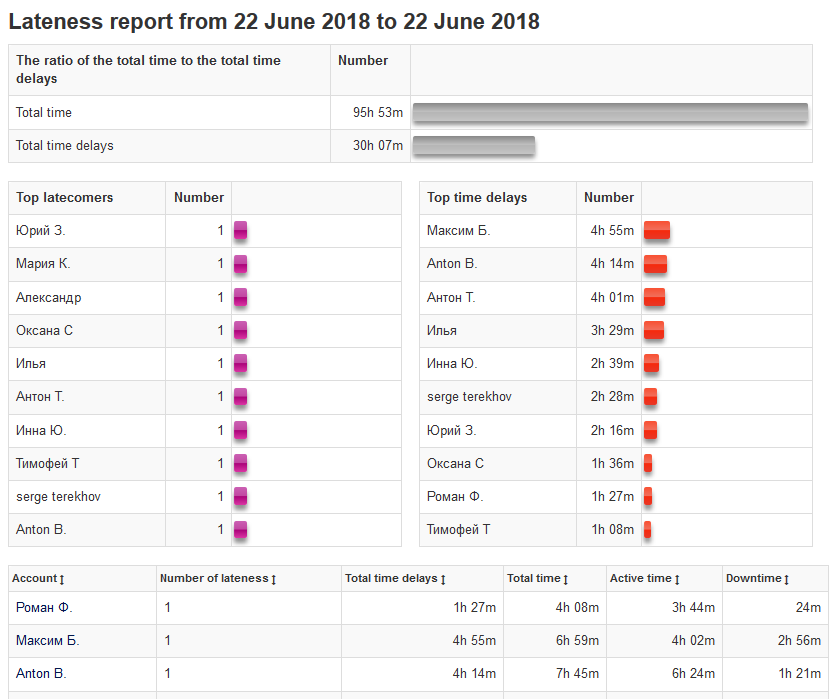
This type of report is based on employees’ lateness event.
Lateness\overtime is calculated based on the specified working schedules.
You can configure “Working schedule” in the “Admin -> Work schedule” or “Admin -> Calendar” menus.
Early coming and leaving
The report displays all deviations from working schedule. Early comings, late leavings, lateness.
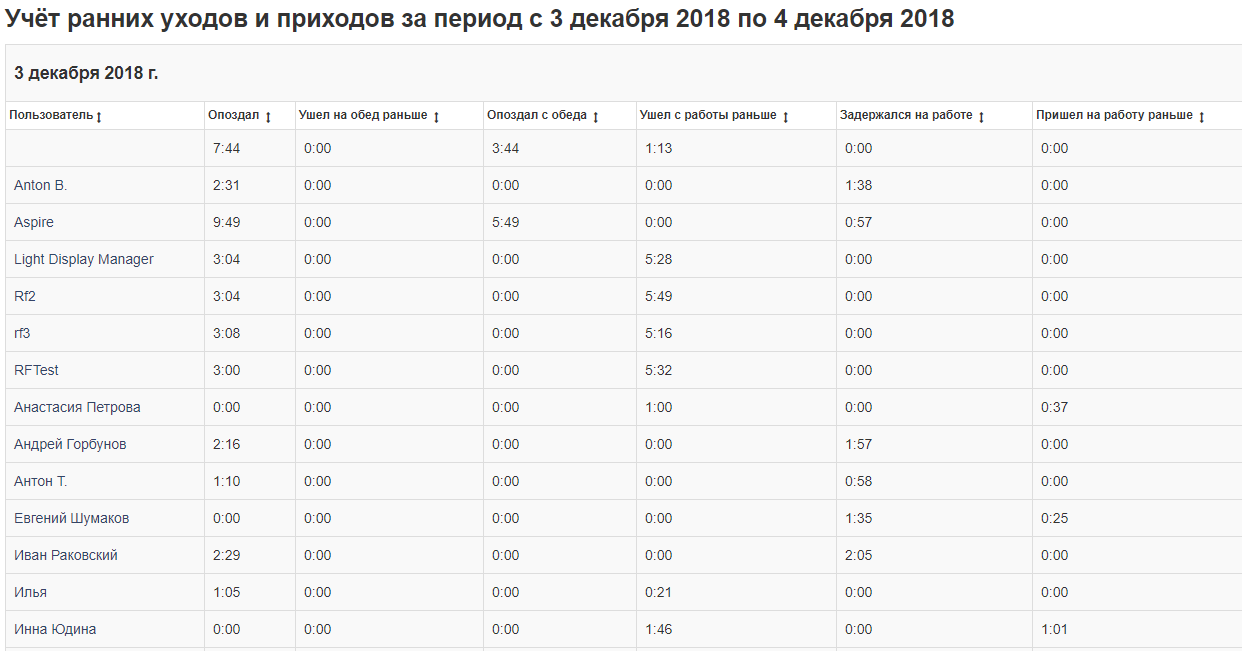
You can configure “Working schedule” in the “Admin -> Work schedule” or “Admin -> Calendar” menus.
Work timesheet
The report displays working time by day, as well as total timr for the current month for each user.
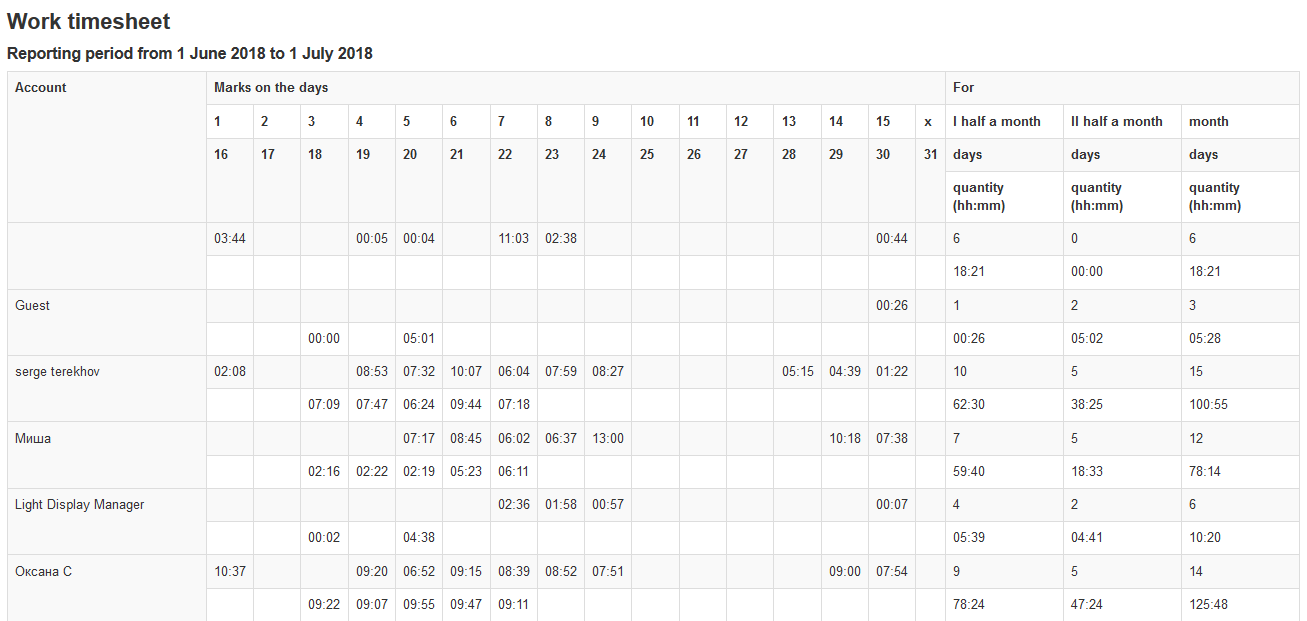
This report shows total active time of user for each working day. Complete report is formed after a month.
There are separate columns for specifying user total activity time for the first half of the month and the second half of the month, and for the whole month.
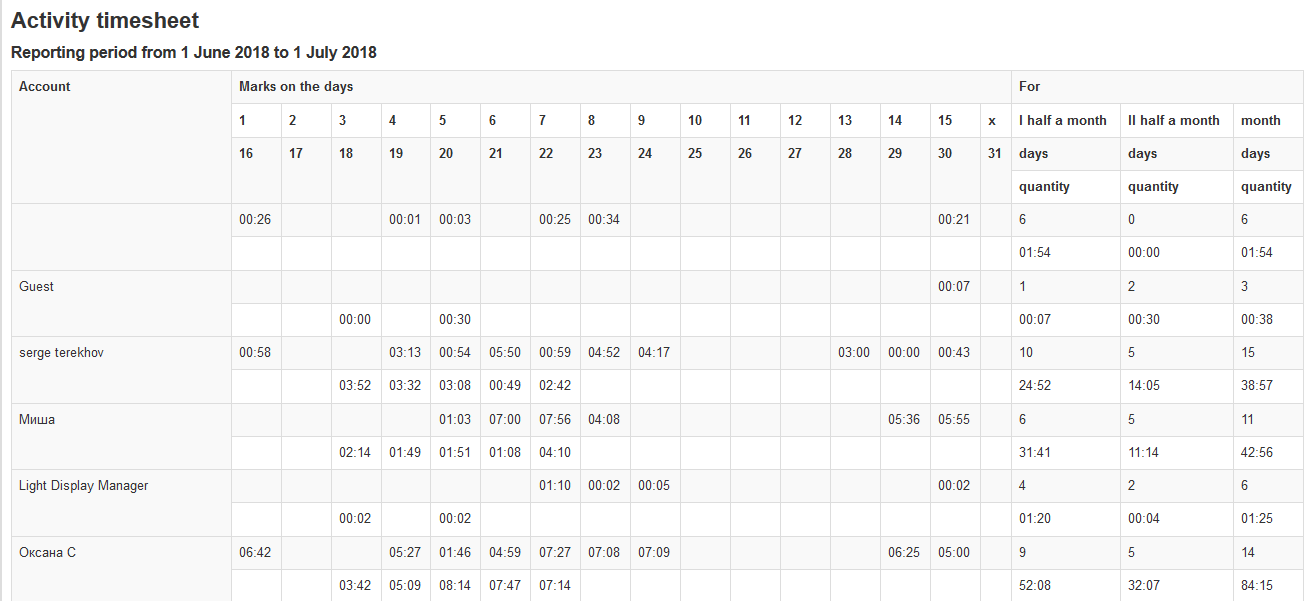
Activity timesheet
The report displays active time by day, as well as total for the current month for each user.
Absence timesheet
The report displays the number of times that the user was not present at the workplace with the “Presence in the workplace” module enabled
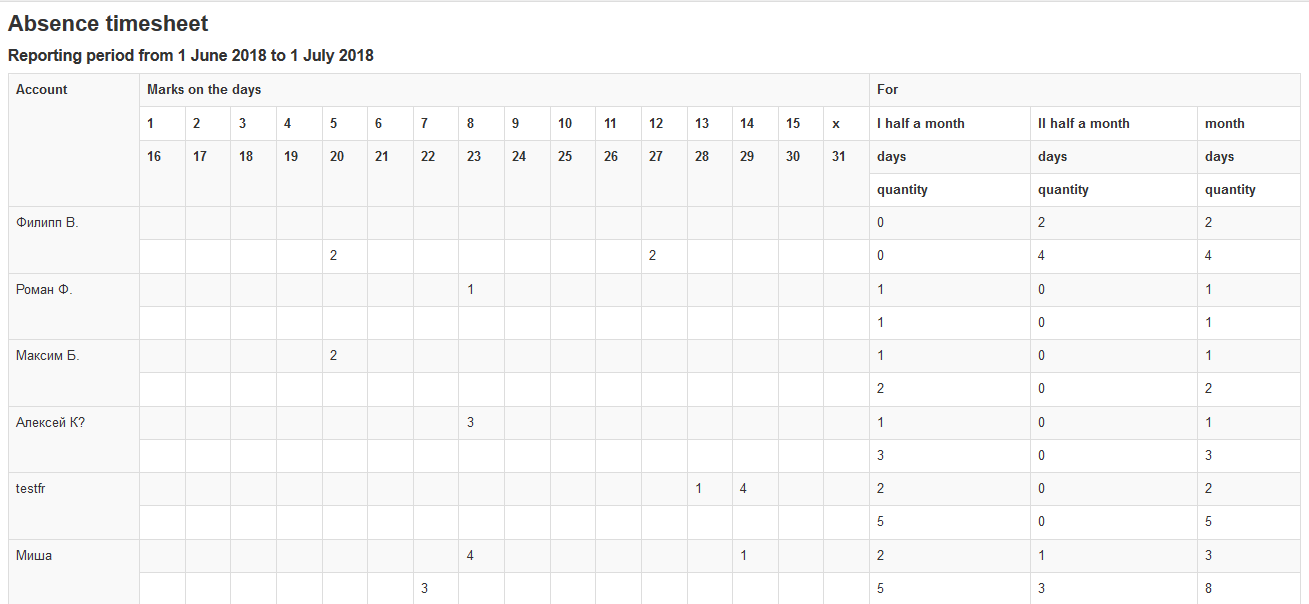
It shows the amount of time the user was not present at the workplace, if the option “Workplace presence control” was enabled. For more details on this option, see the chapter “Configuration”.
Printer usage timesheet
The report displays the number of printed documents by day, as well as the total amount for the month, with the indication of the computer from which the printing was made
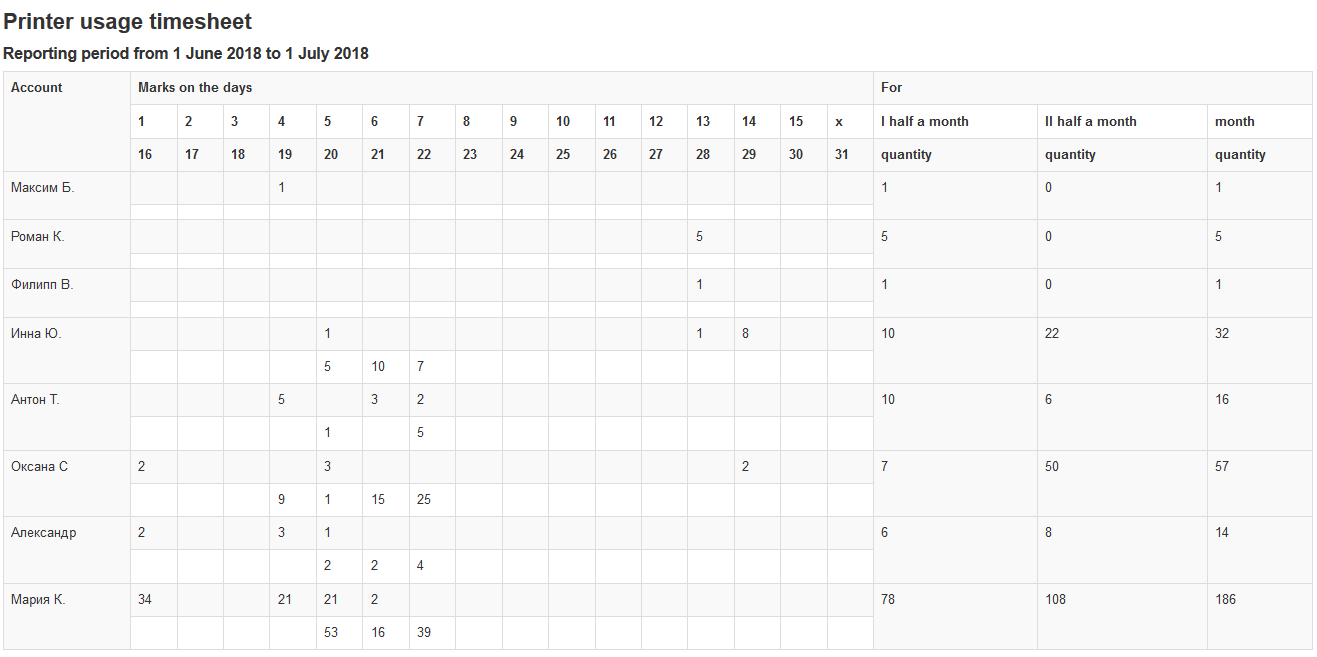
The measurement here is the number of pages printed on a printer by a specific employee per day, half a month, and a month.
In addition, the details of the sum of the printed pages for the first half-month and the second half-month and the total amount of printed pages for the month are displayed.
The report displays the number of messages received/sent, categorized by mail/messengers, as well as the number of intercepted files.
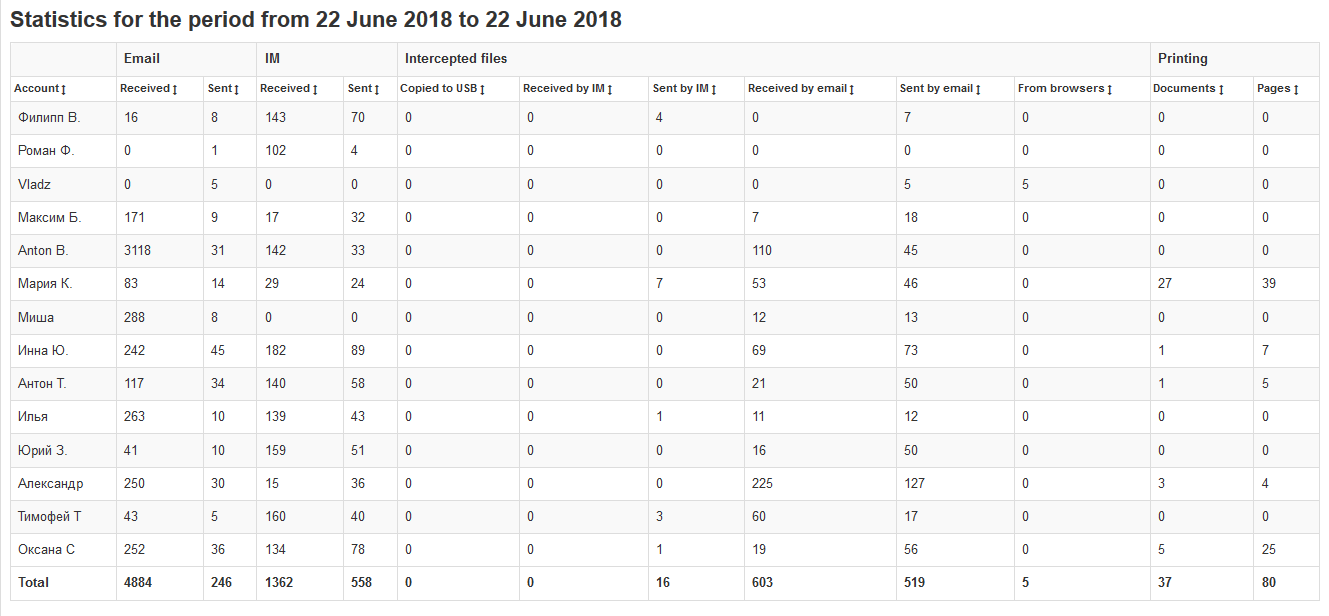
The report presents aggregated information on all users, according to all the observations that agents on users’ workstations could capture, in the form of a table with numbers that mean the number of events on different modules
Here you can have a brief look at what your employees did, how many mails were sent per day, how many messages were written in instant messengers, how many documents were printed and so on.
Also, this report allows you to drill-down into the details of the events that have taken place, which means to view each triggered event separately. To do this, click the number of events you are interested in, and you will see the “Constructor” view with the filter applied to the specified events.
Summary statistics
The report displays the number of messages received/sent, categorized by mail/messengers, as well as the number of intercepted files.
The report presents aggregated information on all users, according to all the observations that agents on users’ workstations could capture, in the form of a table with numbers that mean the number of events on different modules
Here you can have a brief look at what your employees did, how many mails were sent per day, how many messages were written in instant messengers, how many documents were printed and so on.
Also, this report allows you to drill-down into the details of the events that have taken place, which means to view each triggered event separately. To do this, click on the numerical value of the number of events you are interested in, and you will see the “Constructor” view with the filter applied to the specified events.
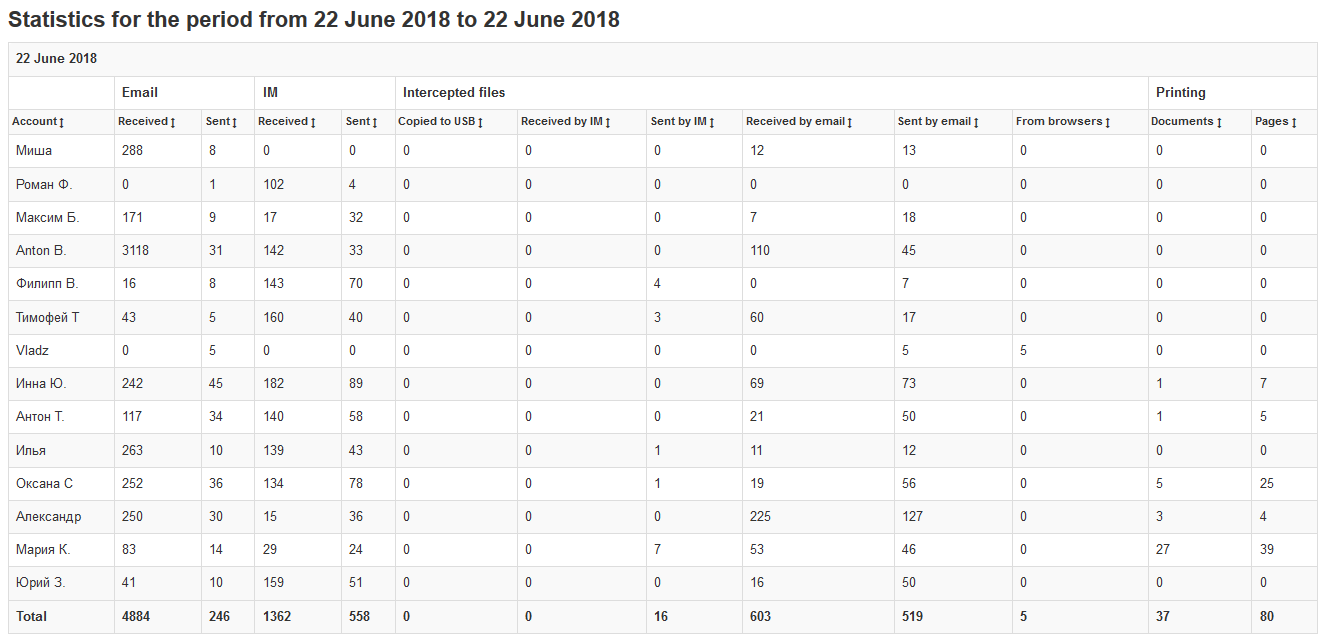
Statistics by day
A variation of “Summary statistics” report, but with a categorization of statistics by day.
Devices inventory
The report displays data on devices in a tabular form, giving the following output: pc, vendor, device type, HWID, availability date.
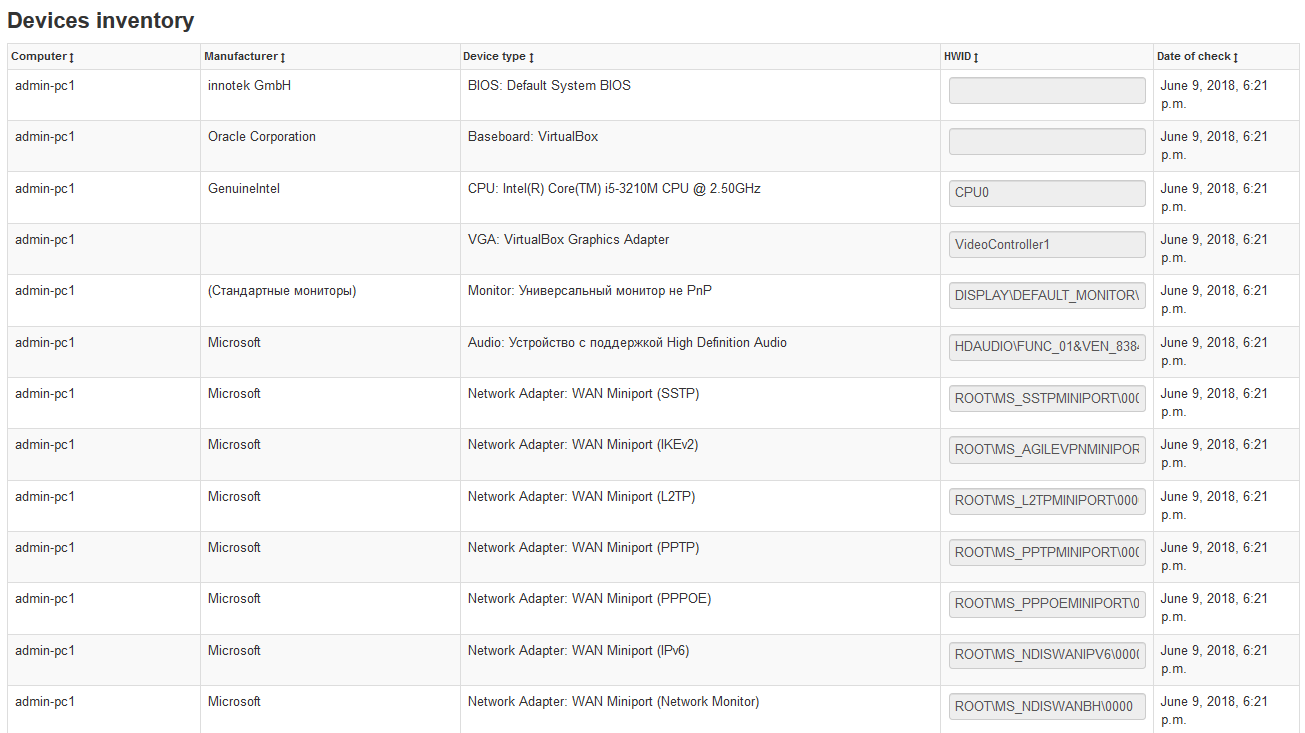
This type of report represents a list of all devices found on workstations users. You can find out what CPU is installed, or the video card, and see all the other devices installed on computers. For this function to work correctly, you should enable “Hardware inventory”, for more details about this function, see “Configuration” section.
Apps inventory
The report displays the information on applications in a tabular form: pc, product, vendor, version, and availability date.
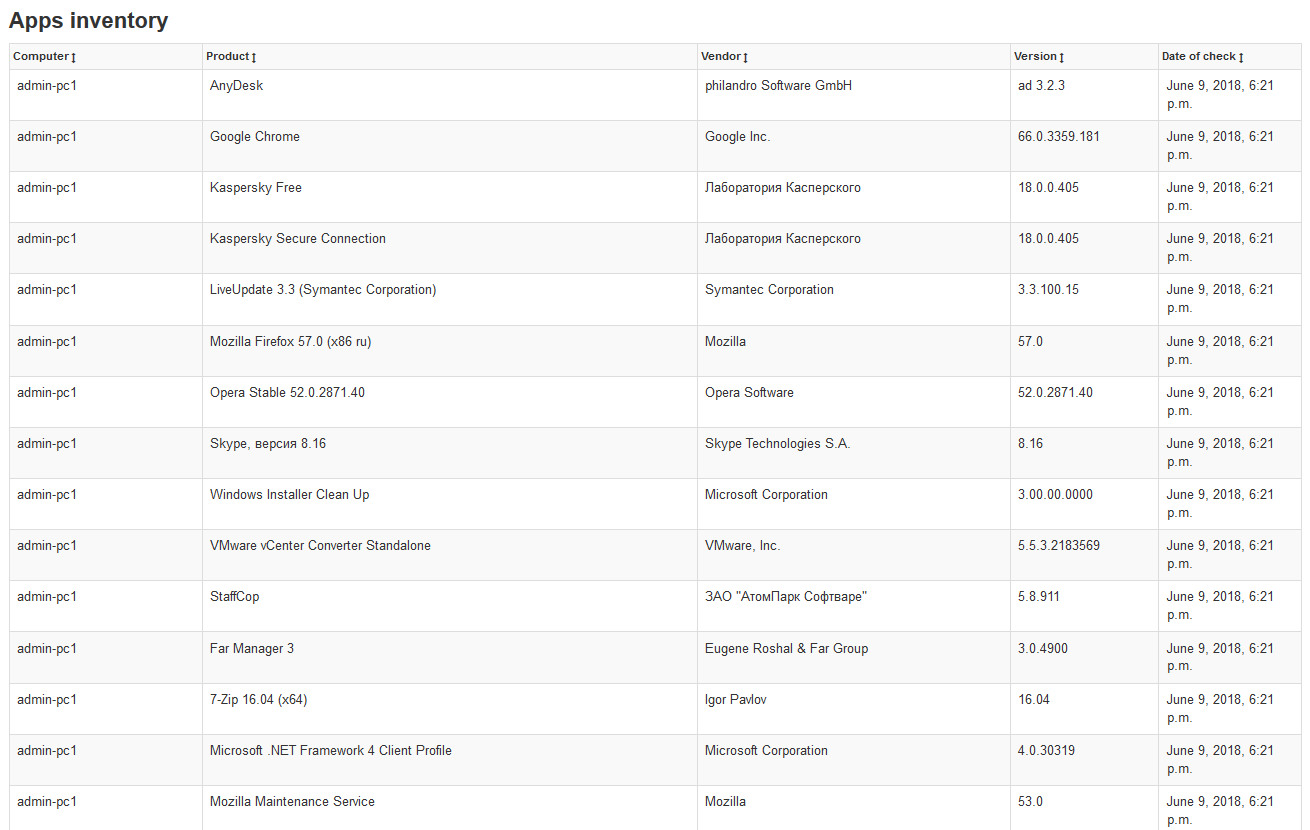
This report provides a list of applications installed on workstations, sent by the agent at the time of its registration on the server.
From time to time, an agent checks the list of applications that are installed in the monitored system so that you can define the installation time of new software and transfer this information to a special type of event - “Installation”.
Facts feed
The report allows you to download all events to a zip file for further local viewing.
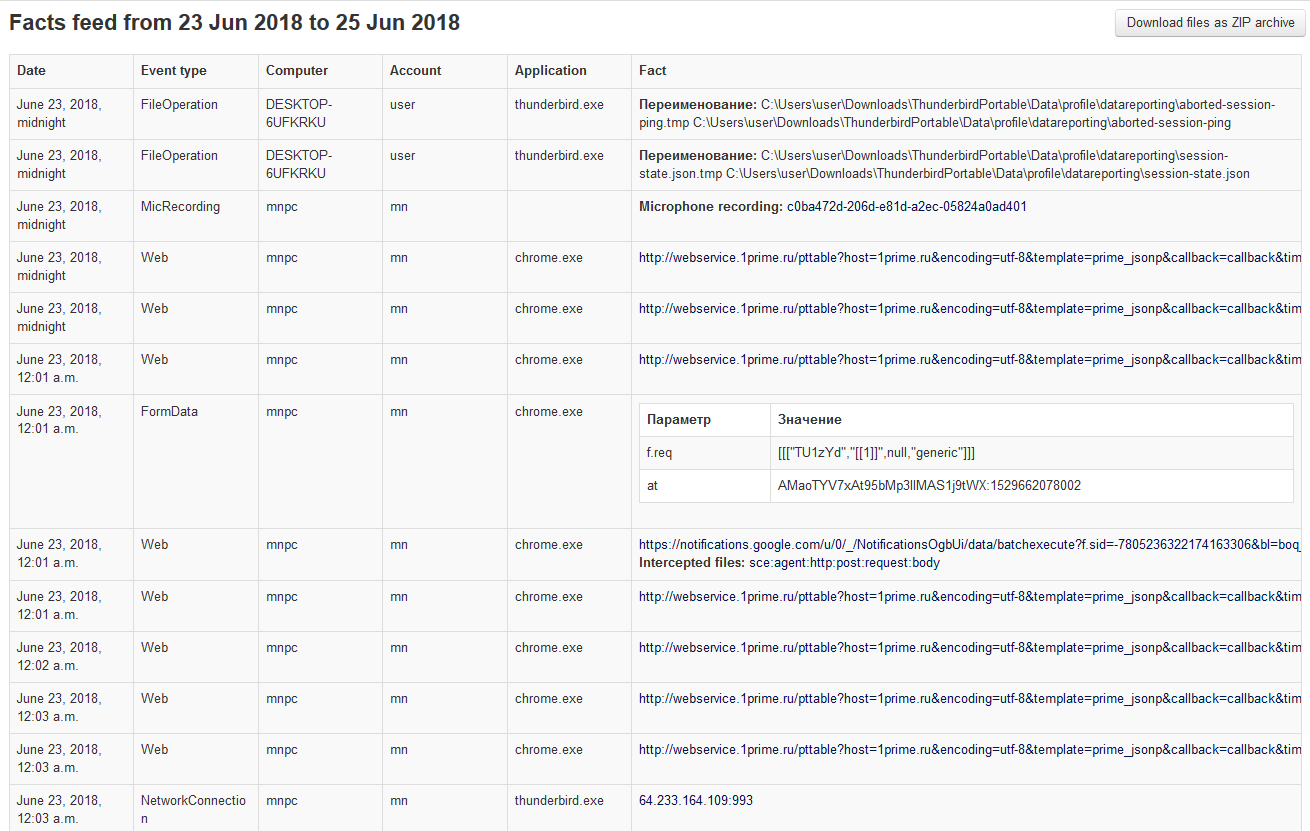
This report can be used to view details on the events of an individual user or group of specially filtered events.
This kind of report loads all the results of applied filters in the form of an event log with a convenient type of viewing information, where you can understand the type of activity that took place at the user’s workplace.
Extended activity report
The report allows you to see the events in the form of a list.
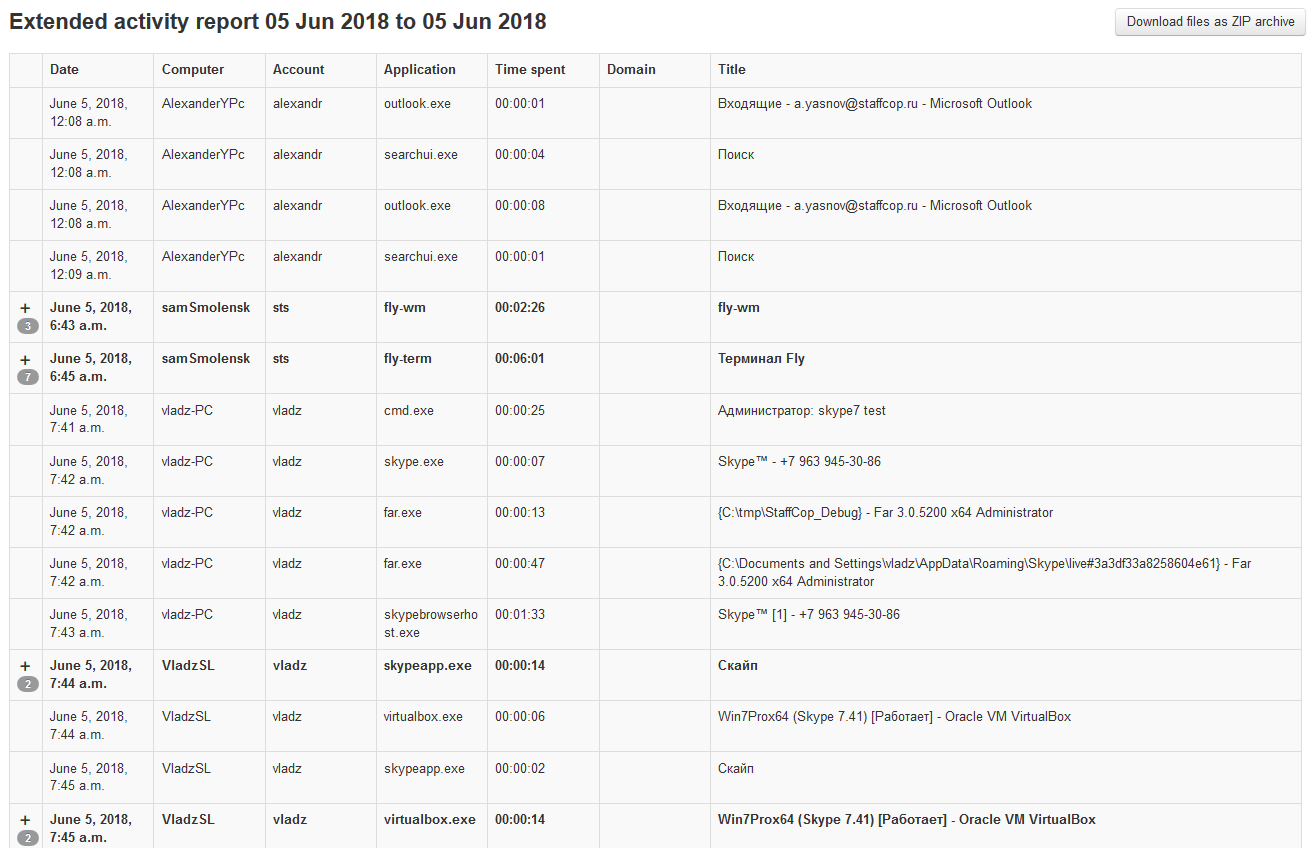
This report suits for downloading all events in a convenient form.
Anomalies report
The report displays an atypical excess of the number of operations for all events, compared to the average statistics for each of the events for the week.
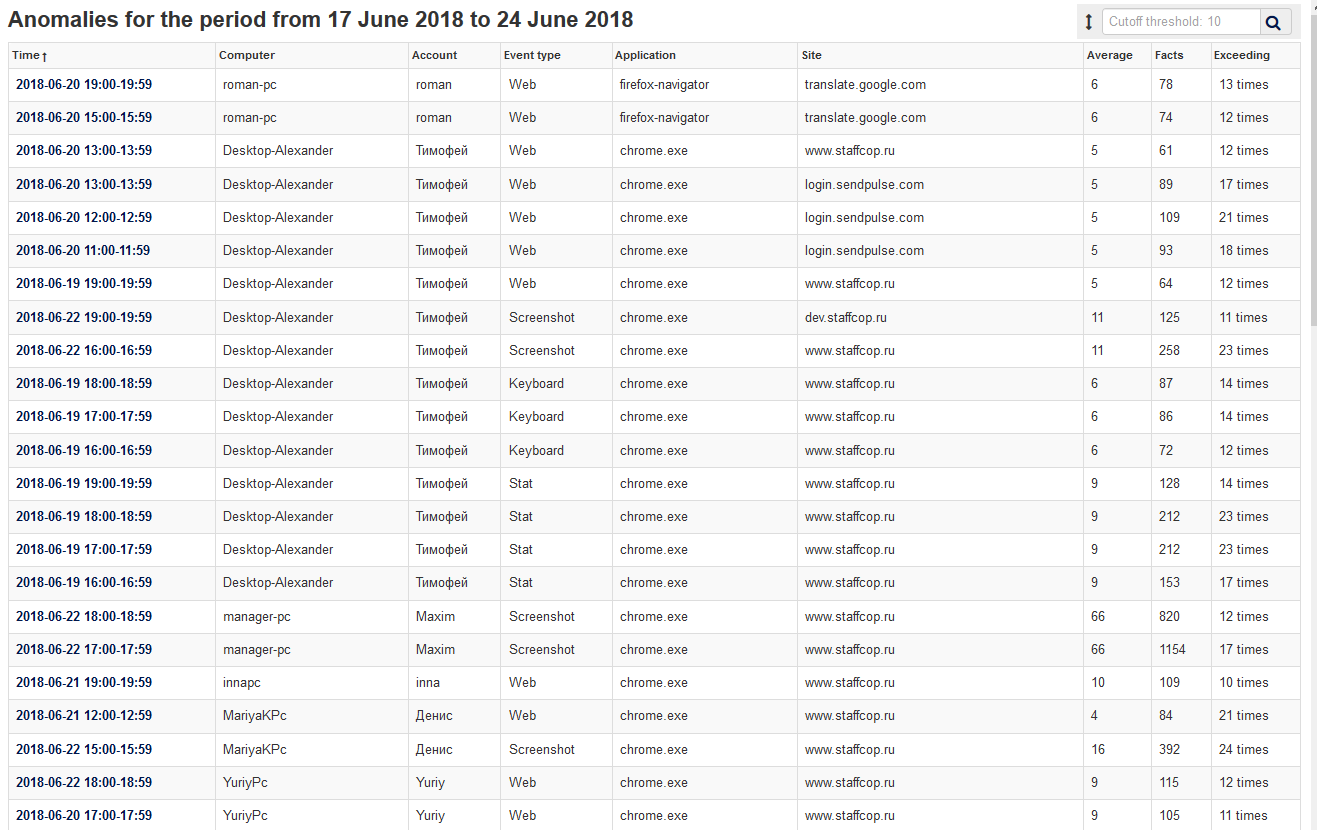
A type of report in which “anomalies” are expressed as intercepted events on workstations.
An anomaly is an excess of the number of certain event type per hour, if it is 10 or more times higher than the usual value calculated for the last week.
The threshold for anomalies triggering can be changed. This threshold is set in the form of a number of exceeding the number of times from usual values of events collected over a certain period of time.
By default, the threshold value is set to 10, this value can be changed in the top-right part of the report.