Lens
“Lens” - the very right part of the window used for displaying events, graphs or reports.
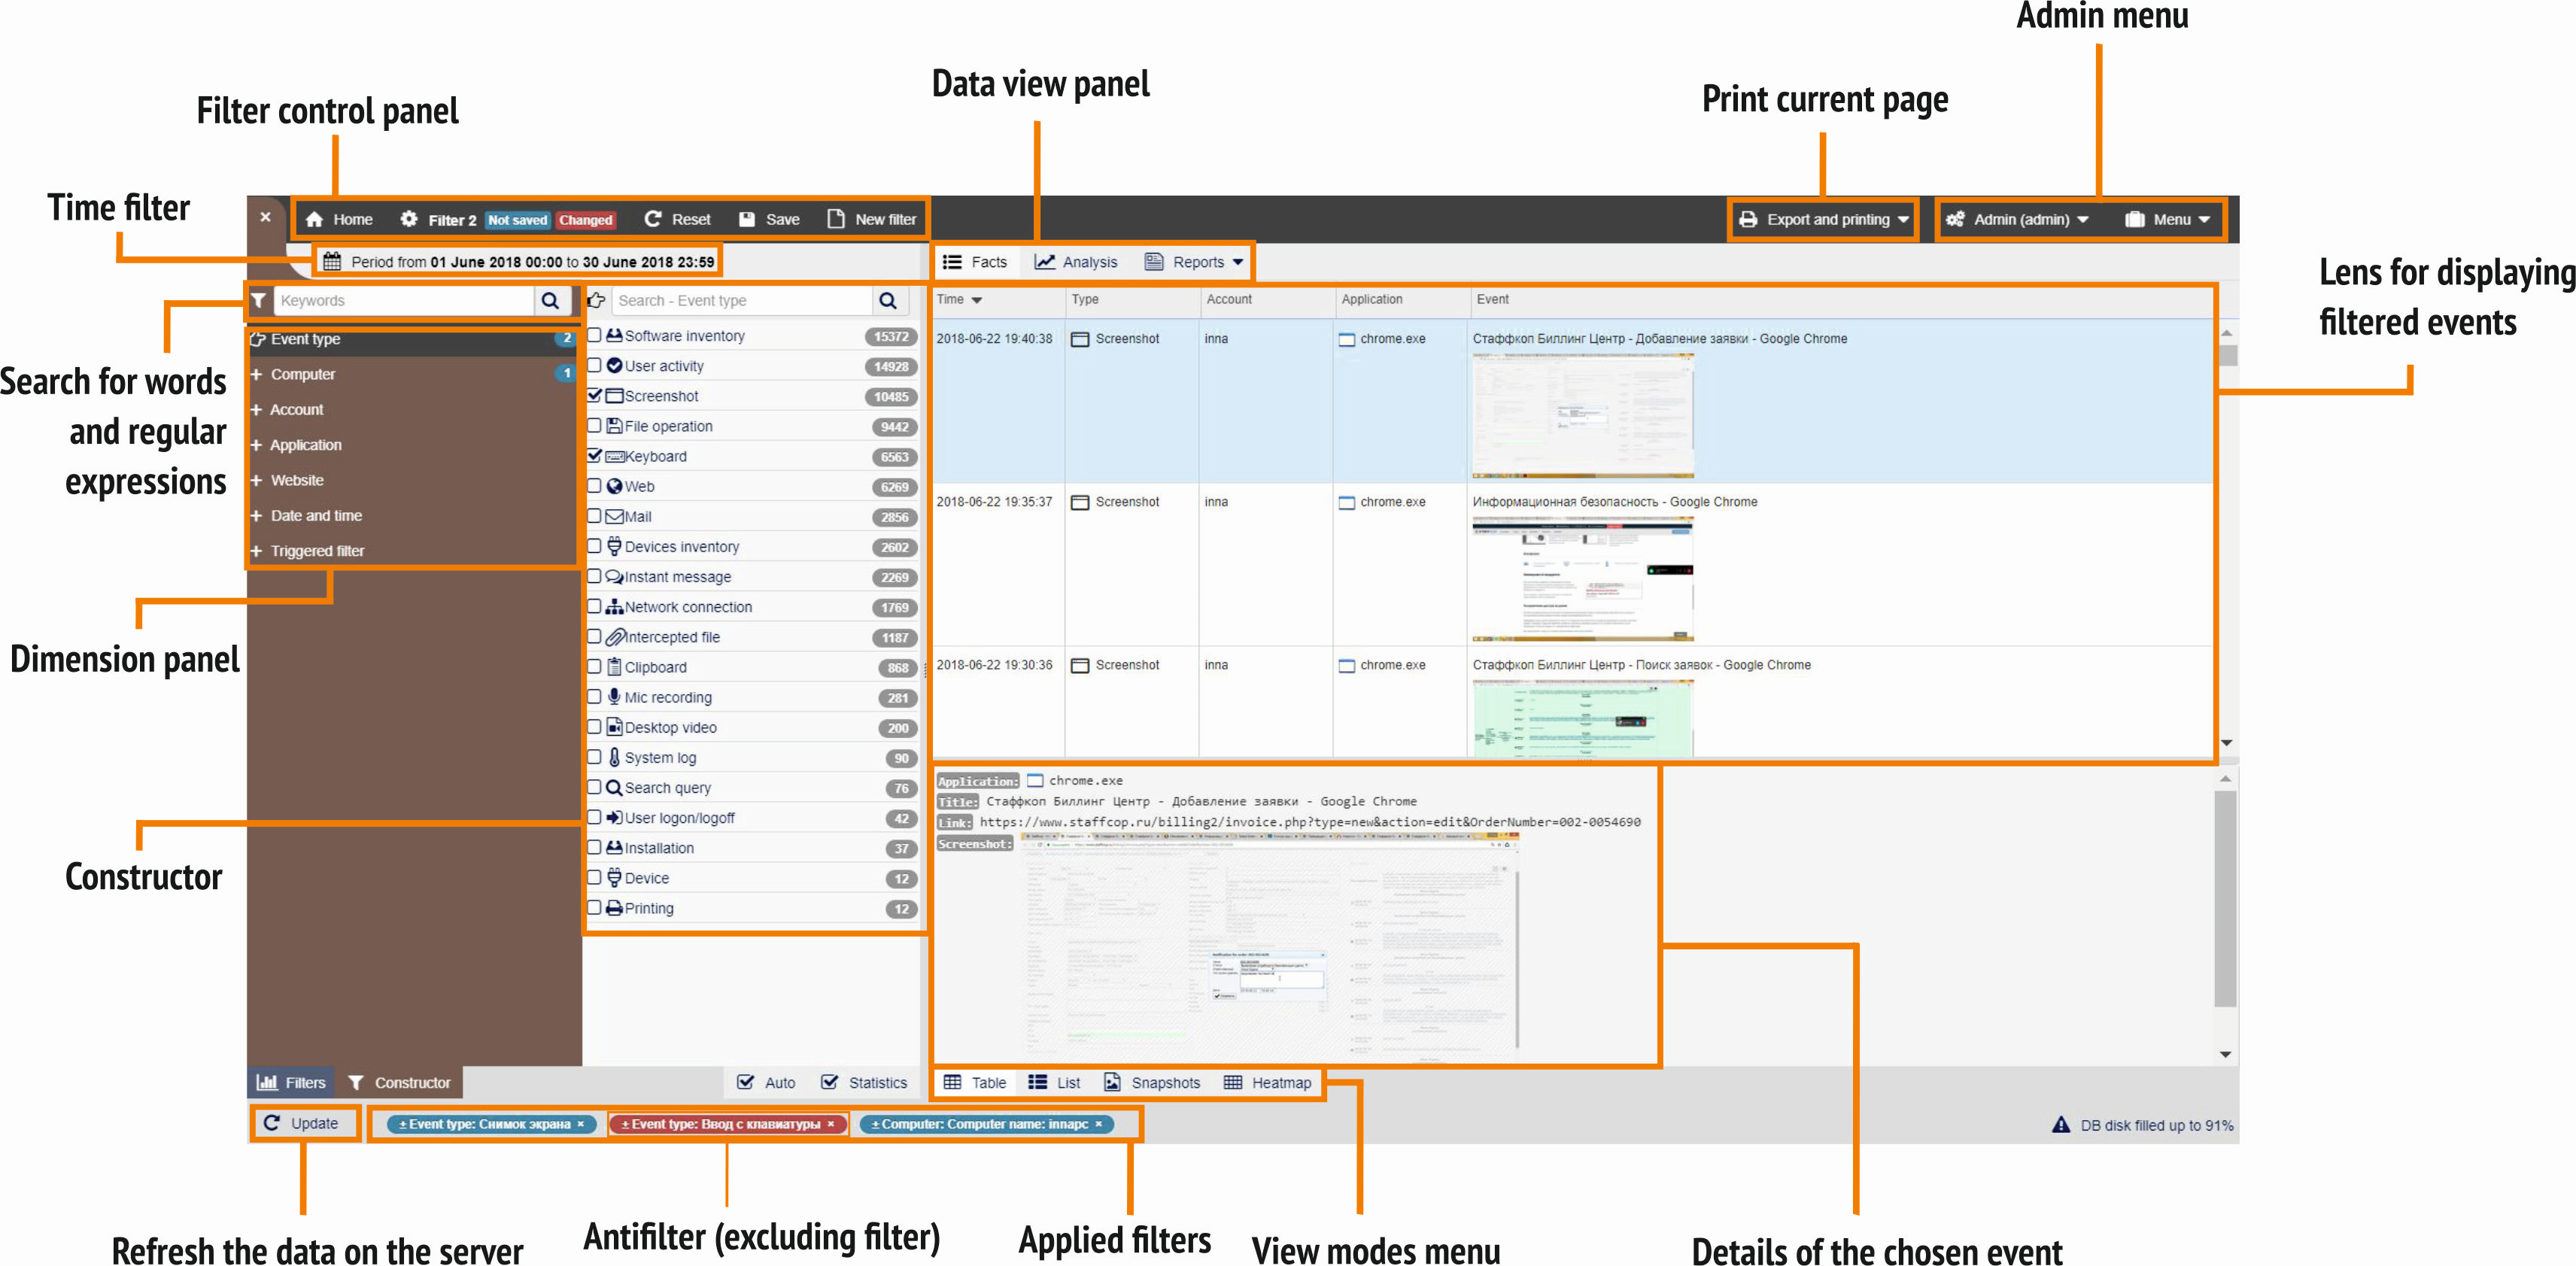
Lens has a menu with items Facts, Analysis, Reports and Time tracking. Here you can view filtered and analyzed information in various view modes.
Facts
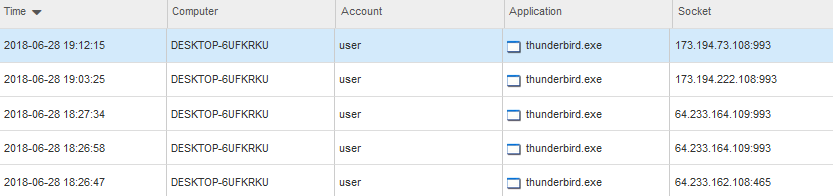
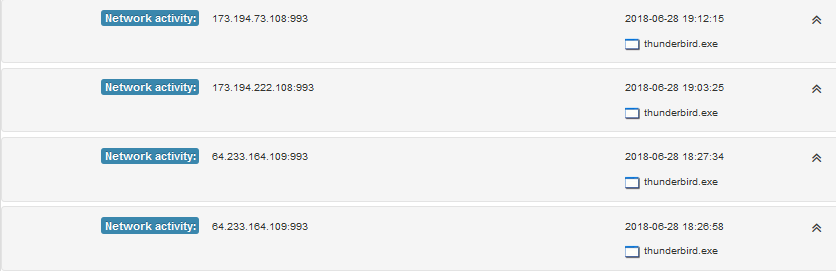
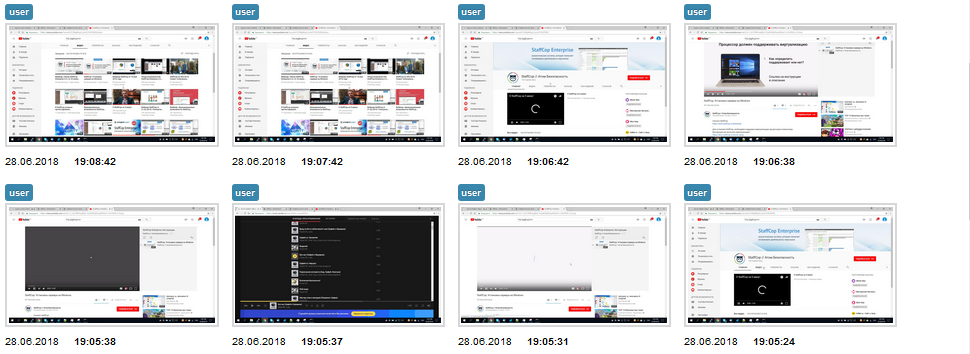
Facts - displays the details of events in a specific form: “Table”, “List”, “Snapshot”, “Heatmap” or “Conversations”.
Table - displays events in a tabular form where each column contains its own value.
List - each event is represented as a separate block.
Snapshots - кeach event is represented by a thumbnail. It is usually used for viewing “Screenshots”.
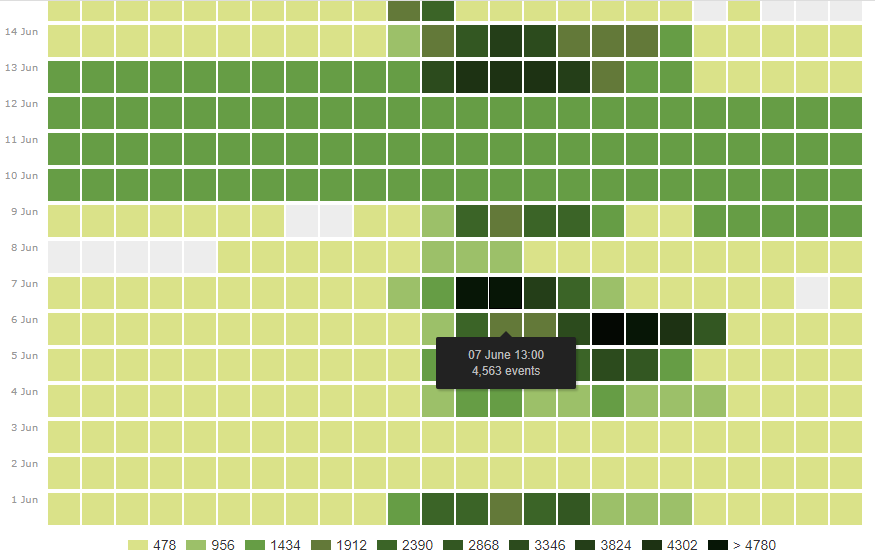
Heatmap - displays the number of events for specific time period, in the form of a a heatmap. Heatmap is a handy tool for visualizing the number of events over a period of time. Also, heatmap can be used to analyze the frequency of certain user actions. Heatmap is clickable - you can drill-down to every period of time and see the details of the events you are interested in.
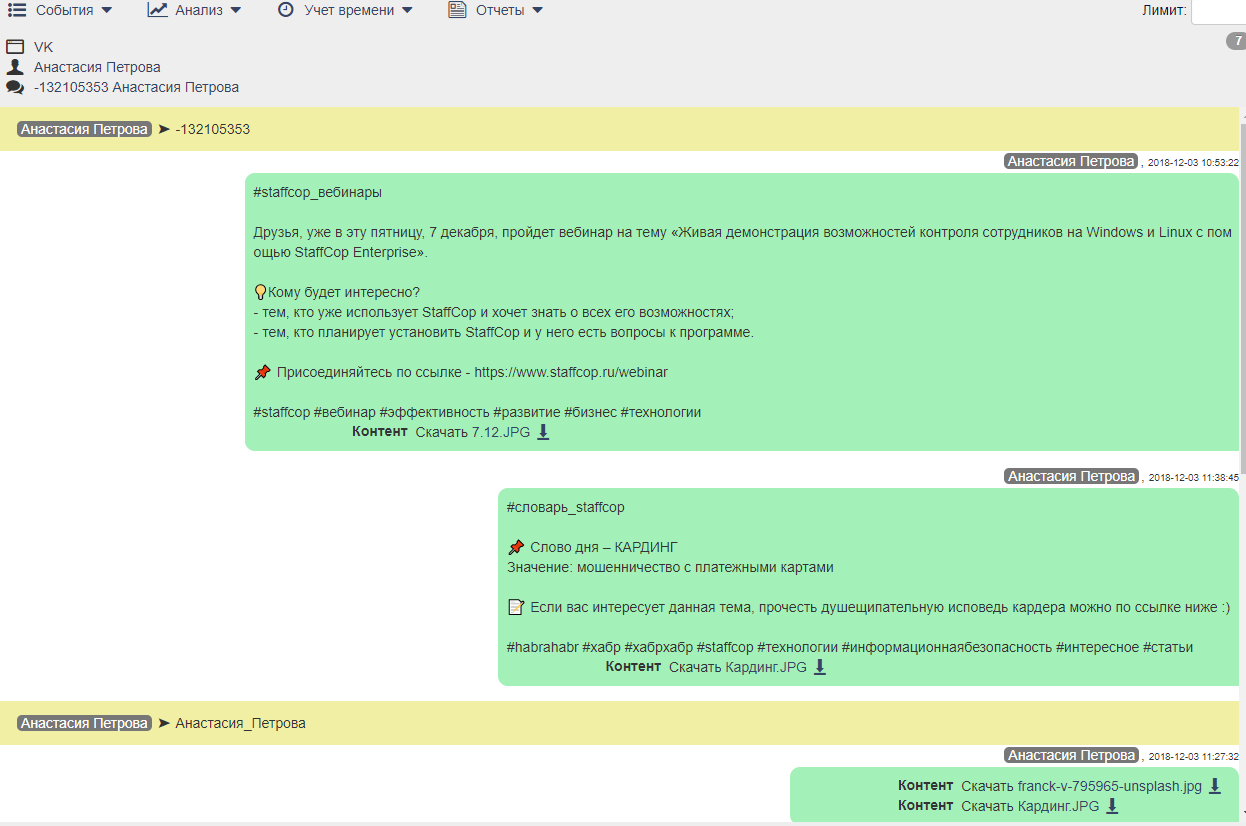
Conversations - displays events of types “Mail” and “Instant message”
Deleted files
Files that for some reason are no longer on the server are marked as deleted by such an icon  .
.
Analysis
Analysis - allows you to analyze and observe statistics on the collected data from agents, which means, to build filters in filters, thereby obtaining an additional slice of information using the methods of displaying information: “Table”, “Linear Chart”, “Pie Chart”, “Radar”, “River of events”, “Graph” and “Tree”.

Note
Starting from the version 4.3, we added options that allow dragging the added filters with the mouse. Now you can sort data by one or several columns. These features make it easy and convenient to manage lists of filtered information.
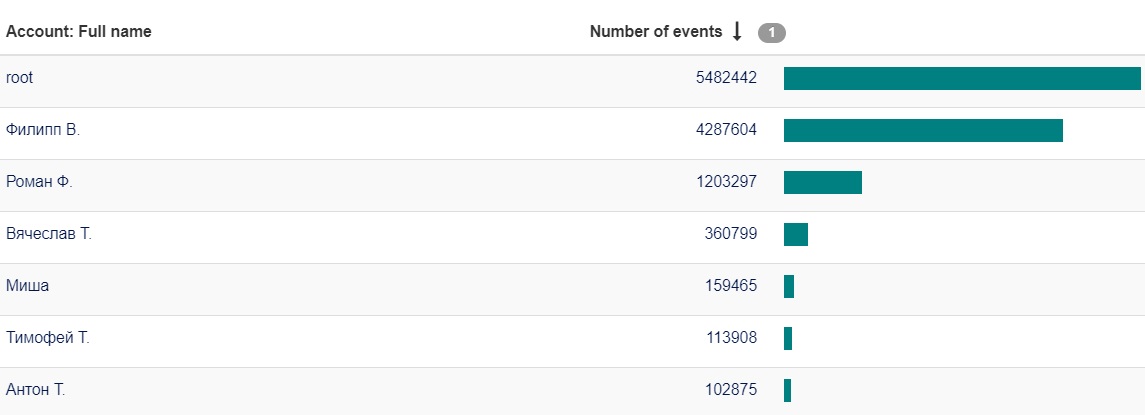
Table - displays events on the selected PC and filter in a tabular form.
Linear chart - displays the number of events for the selected filters in the form of columns of the graph. There is a graph switching at the top of the graph between “Linear chart”, “Bar chart”, “Stacked” and not “Stacked”. The image is clickable.
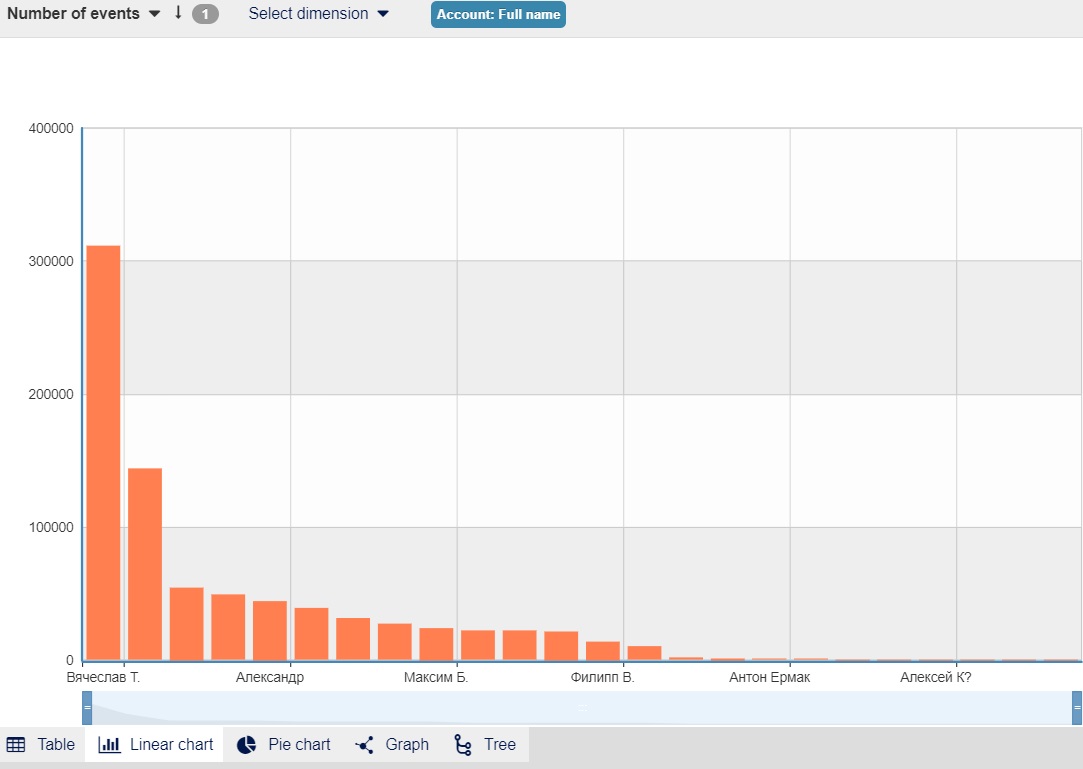
To save the output as an image, click “Save”

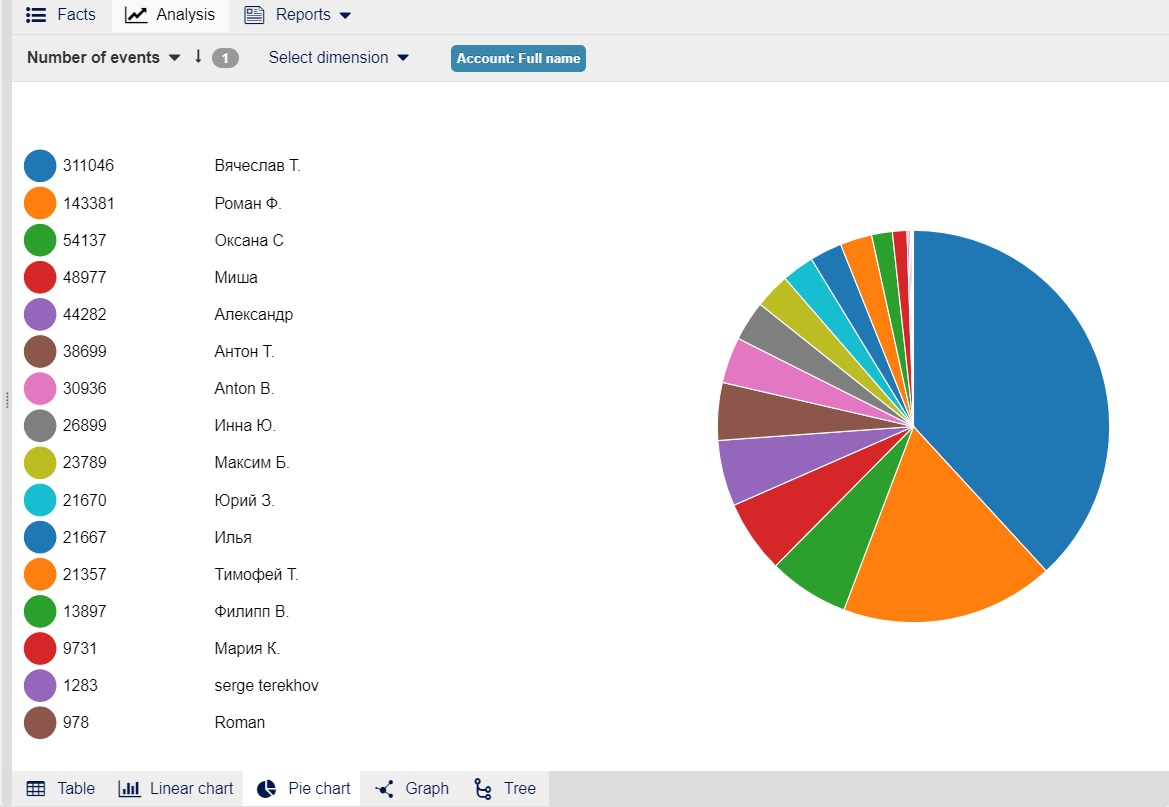
Pie chart - displays the number of events in the form of a pie chart. Embedded filters are supported, for example, you can select the application - browser.exe as the filter, and as the second filter - Websites - URL.
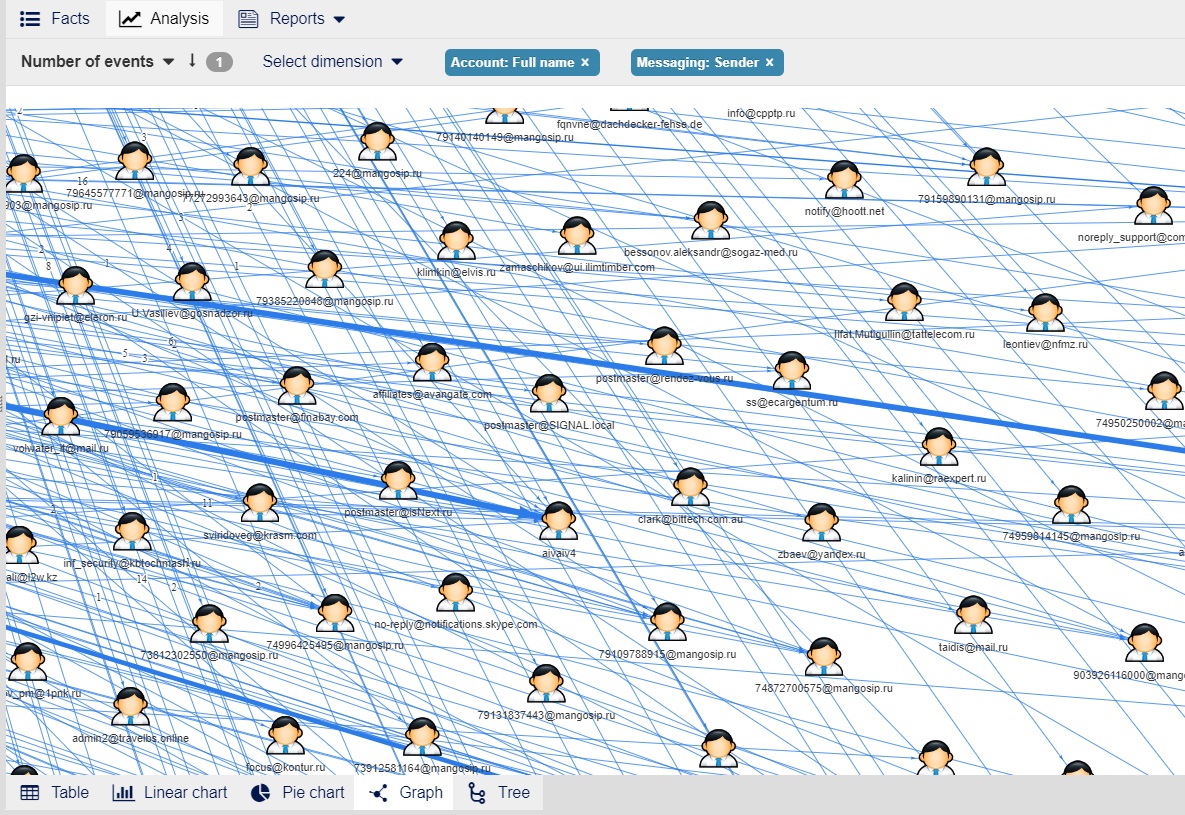
Graph - builds a graph in the form of a mind-map. The image is clickable.
Tree - builds a tree of relations. The image is clickable.
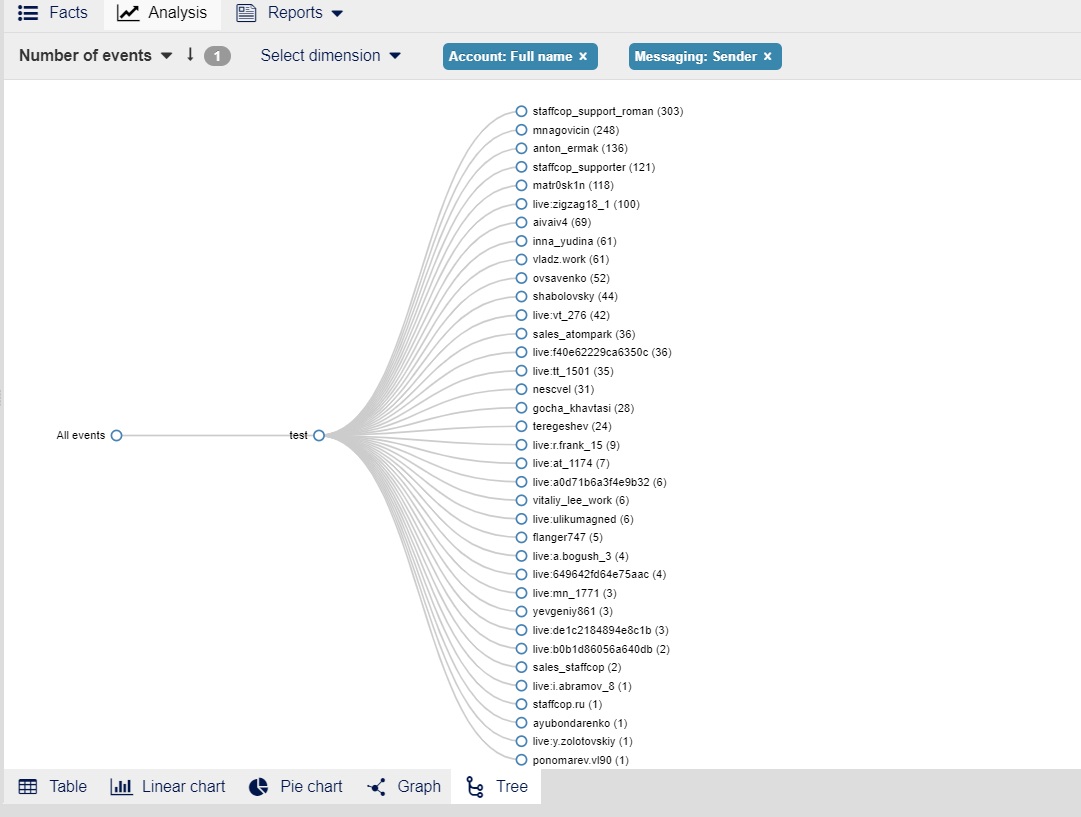
The tree can be downloaded for printing, you can “drill-down” into events when you click on the tree element and get detailed information on the selected tree branch of the displayed events.
Time tracking
Time tracking and Reports - the output of the analyzed information on certain templates. These reports are used to quickly obtain the necessary summary information on users.
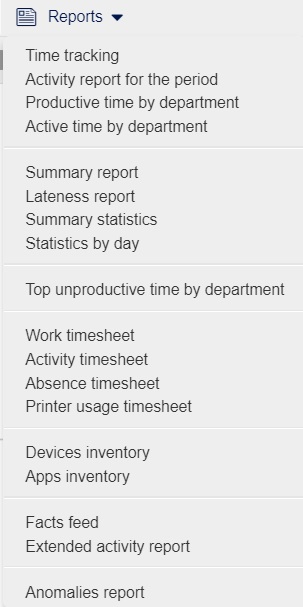
Time tracking - displays working time and its category - productive/unproductive/neutral, as well as downtime.
Activity report for the period - indicates active time, its productivity, top applications, top websites.
Productive time by department - displays top users with the maximum productive time, categorized by department.
Active time by department - displays the activity time by departments, indicating the top active and inactive users.
Top unproductive time by departments - displays top users with maximum unproductive time, categorized by department.
Summary report - displays categorized activity time.
Lateness report - displays the number and time of delays.
Early coming and leaving - displays time of late leavings and early comings according to the current working schedules.
Timesheets
Work timesheet - displays working time by day, as well as total time for the current month for each user.
Activity timesheet - displays active time by day, as well as the total for the current month for each user.
Absence timesheet - displays the number of days the user were absent at the workplace, it is based on the “Working schedule” and “Calendar”.
Printer using sheet - displays the number of printed documents per day, as well as the total for the month, indicating the computer which sent the file to the printer.
Reports
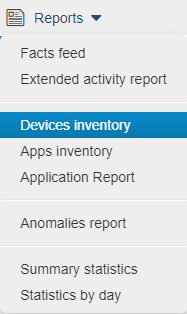
Summary statistics - displays the number of messages received/sent, categorized by mail/messengers, and the number of intercepted files.
Statistics by day - combined statistics for several days.
Devices inventory - shows the data about devices in the tabular form, with the following output: pc, vendor, device type, HWID, date of availability.
Apps inventory - shows the application data in the tabular form: pc, product, vendor, version, and availability date.
Facts feed - allows you to download all events to a zip file for later local viewing.
Extended activity report - allows you to see events in the form of a text-list.
Anomalies report - displays an atypical excess of the number of operations for all events, compared to the average statistics for each of the events for the week.
To see full details on reports refer to this article: Reports
Export and printing
Downloading and printing of filtered event data is done with the “Export and printing” button.
Note
Starting from version 4.3, we made it possible to download data from the event table. To download events, you need to click the Export and printing button and select the Export to CSV option.